Analysis of State and Federal Spending on Infrastructure
Infrastructure is all around us, it allows us to subsist. It’s easy to take for granted, too. Infrastructure is embedded in our lives: the roads we drive, the pipes that deliver us water, the airports we travel through. Turns out, the state of American infrastructure is in constant flux (sometimes dramatically so) and always a point of spirited debate. That debate becomes particularly interesting when infrastructure is compared state to state.
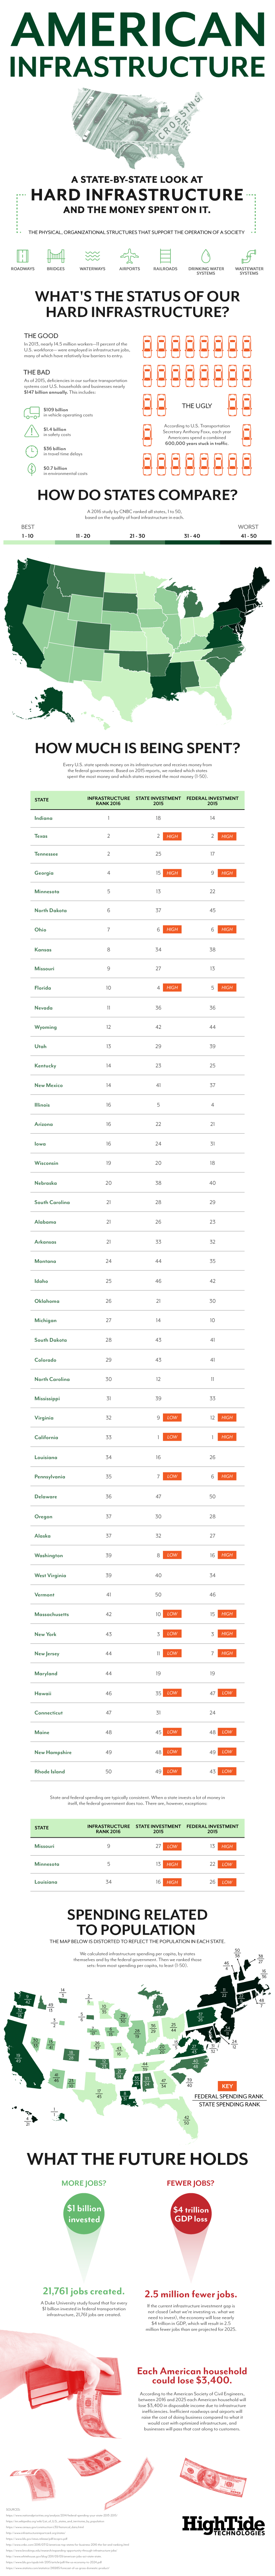
For this analysis, we defined infrastructure as the physical and organizational structures that support the operation of a society. That definition is fundamentally and necessarily broad because the infrastructure has a wide footprint. As of 2013, 14.5 million workers—11 percent of the U.S. workforce—called themselves employees of infrastructure.
On the one hand, that’s a lot of people. On the other, it’s small—considering how much help our infrastructure actually needs. Take our surface transportation systems, for example. As of 2015, deficiencies in American transportation infrastructure cost households and businesses nearly $147 billion a year. And $36 billion of that comprises—no surprise—travel delays. According to U.S. Transportation Secretary Anthony Foxx, each year Americans spend a combined 600,000 years stuck in traffic. Talk about road rage.
Is there anything to be done? Well, generally, when a state invests a lot of money in its infrastructure, the federal government does too. And more money for infrastructure, logically, leads to improvements.
The states that invest the most in infrastructure include Texas, Florida, Ohio, Illinois, California, and New York. Still, likely due to their population size, cities in these states—Chicago, New York, Miami, San Francisco, and LA—remain some of the most congested in the country.
The states that spend the least? Hawaii, New Hampshire, Maine, Vermont, Delaware, Wyoming, North Dakota, and Rhode Island are all at the bottom of the spending spectrum. And yet, in terms of traffic, only Hawaii—with Honolulu—finds itself a victim of truly heinous traffic congestion.
So what about when states are ranked differently—say, by infrastructure spending per capita, to reflect fluctuations in population? We calculated infrastructure spending per capita—from the states themselves, and from the federal government—and tracked the results. States like Texas, Utah, Ohio, and California spend a lot on infrastructure themselves but do not receive commensurate funding from the federal government.
Conversely, states like Georgia, Missouri, New Jersey, and Rhode Island have the opposite problem: They receive, relative to other states, plenty of federal infrastructure funding, but do not dole out state funding for infrastructure to the same degree.
With many states struggling with funding discrepancies, the future of infrastructure may be faulty. According to experts, if the current infrastructure investment gap—what is invested vs. what needs to be invested—is not closed, the US economy will lose nearly $4 trillion in GDP by 2025.